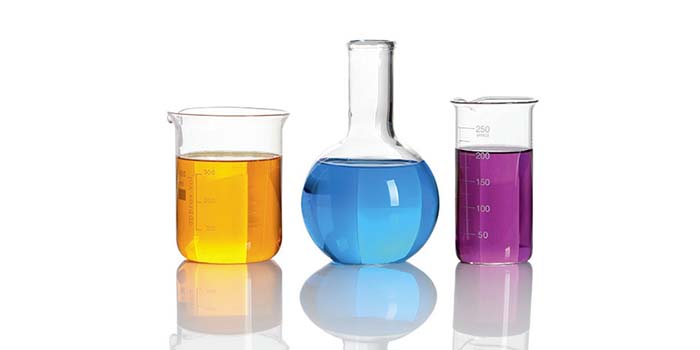
The color can be of crucial importance for the market success of a product. Especially when using natural or recycled raw materials with fluctuating composition the permanent and objective control of the color effect is an essential prerequisite for a constant quality.
With the Chroma software package and a PC-controlled spectrophotometer the spectral transmittance and reflectance properties of glasses and other materials can be accurately determined. From this the Helmholtz and CIELAB color values are calculated and displayed.
Chroma combines measurement and evaluation with a powerful database in which all results are stored in a structured manner. Chroma ensures the traceability and complete documentation of all processes and supports the user actively in the implementation of quality standards.
Chroma meets the requirements of routine analysis and quality control and fulfills the highest demands of research and development through flexible evaluation options and statistical functions. Notwithstanding, Chroma is always intuitive, easy and safe to use.
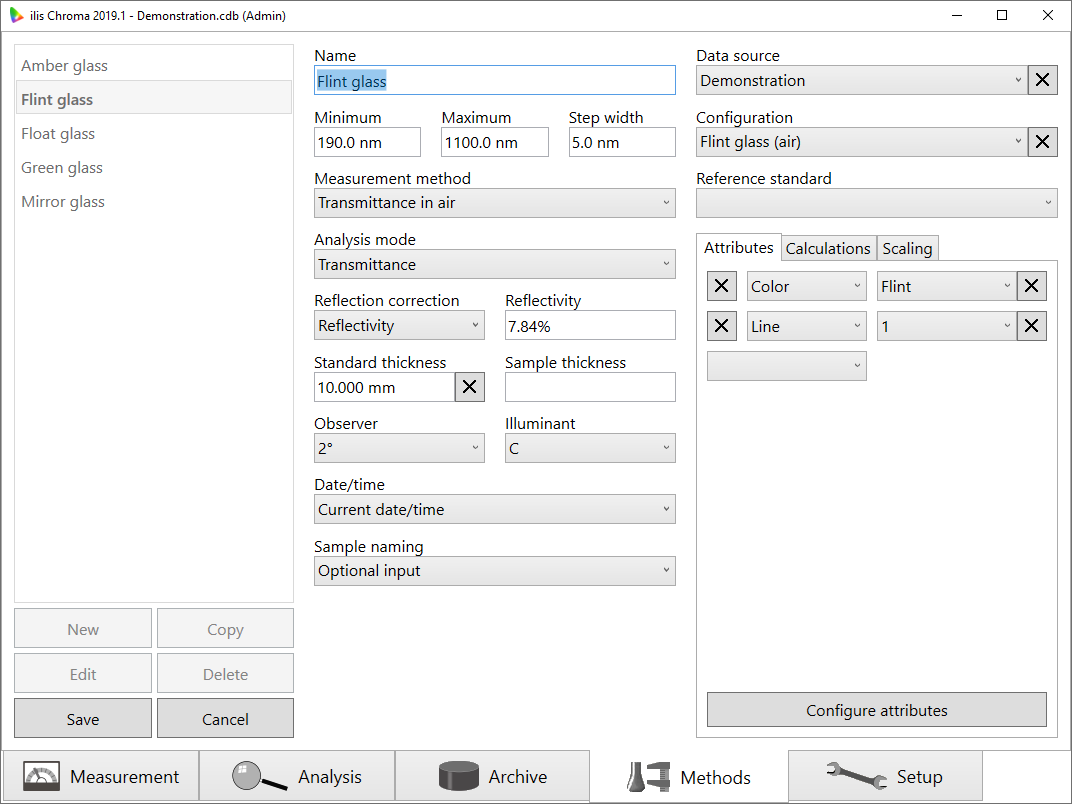
All parameters necessary for the measurement are summarized in so-called methods.
This ensures that measurements are always made with the same settings.
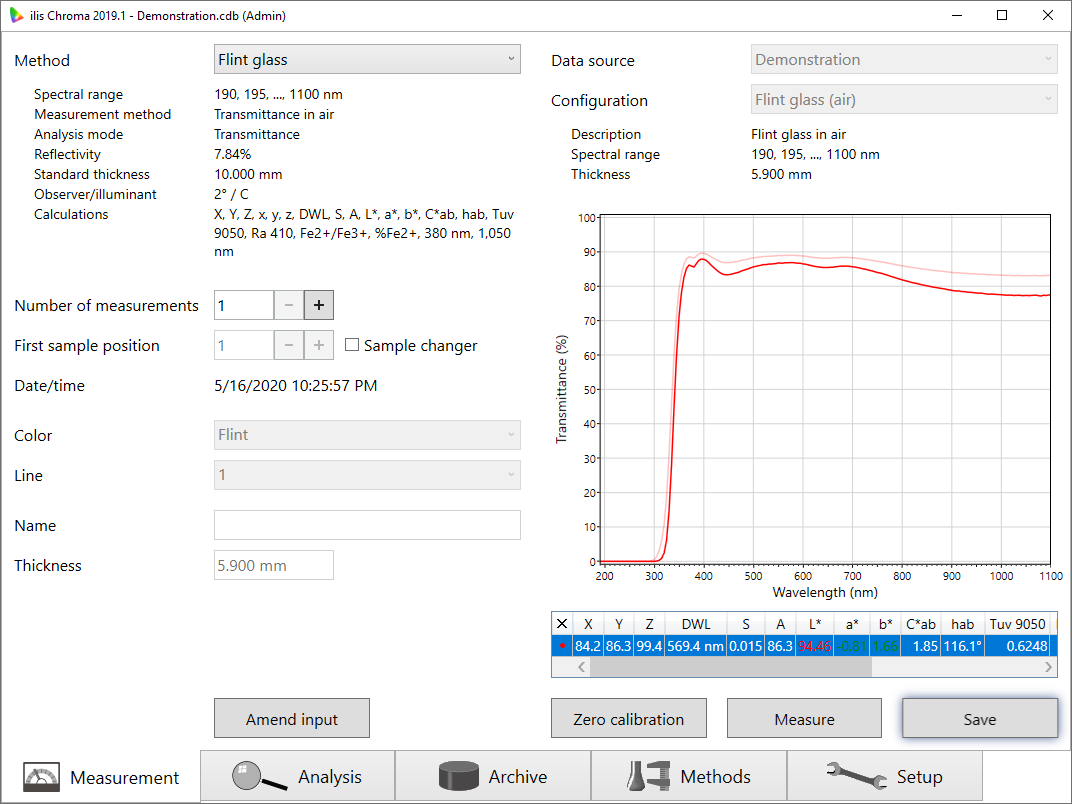
Before the measurement, only the missing sample parameters, e.g. the sample thickness, have to be completed.
Transformations defined in the method, for example the conversion to a fixed reference thickness, are taken into account during the measurement and the corrected spectrum is displayed in addition to the raw spectrum.
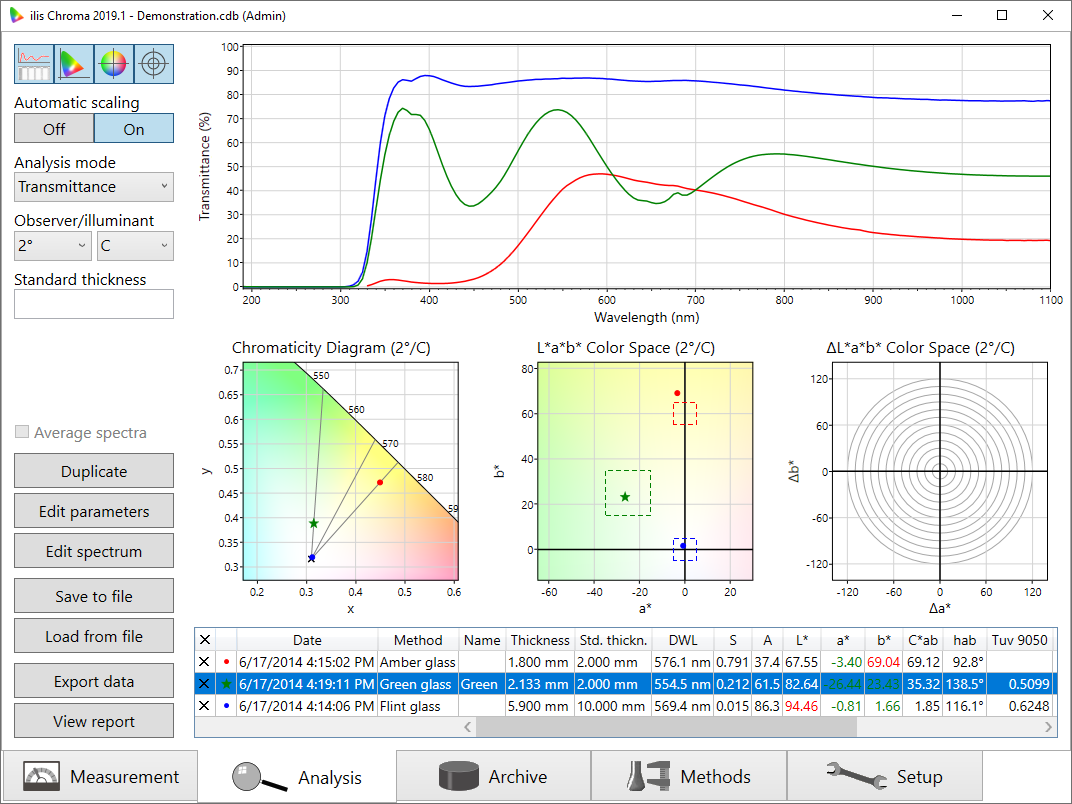
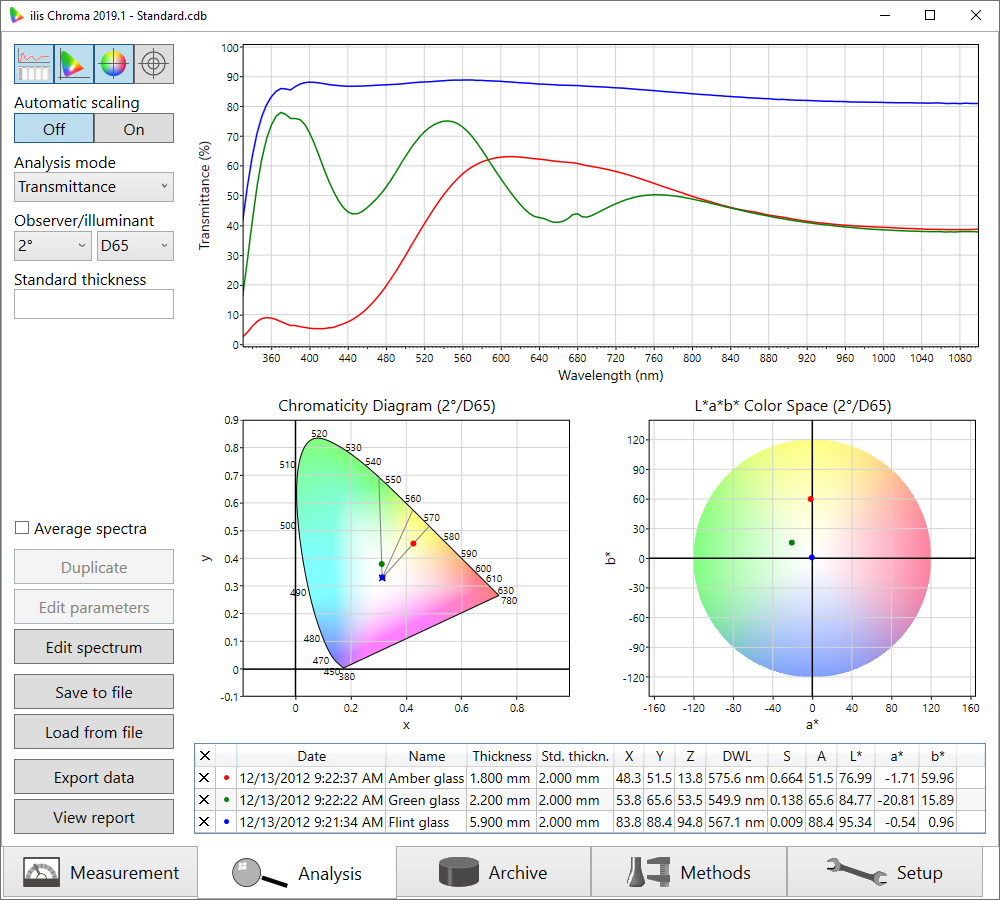
After saving, the user automatically enters the analysis mode, in which all results are displayed in numerical form as well as graphically.
Here one can print the results or export them to other programs for further processing.
Furthermore, certain parameters can be changed later in the analysis mode, of course without affecting the results already stored in the database.
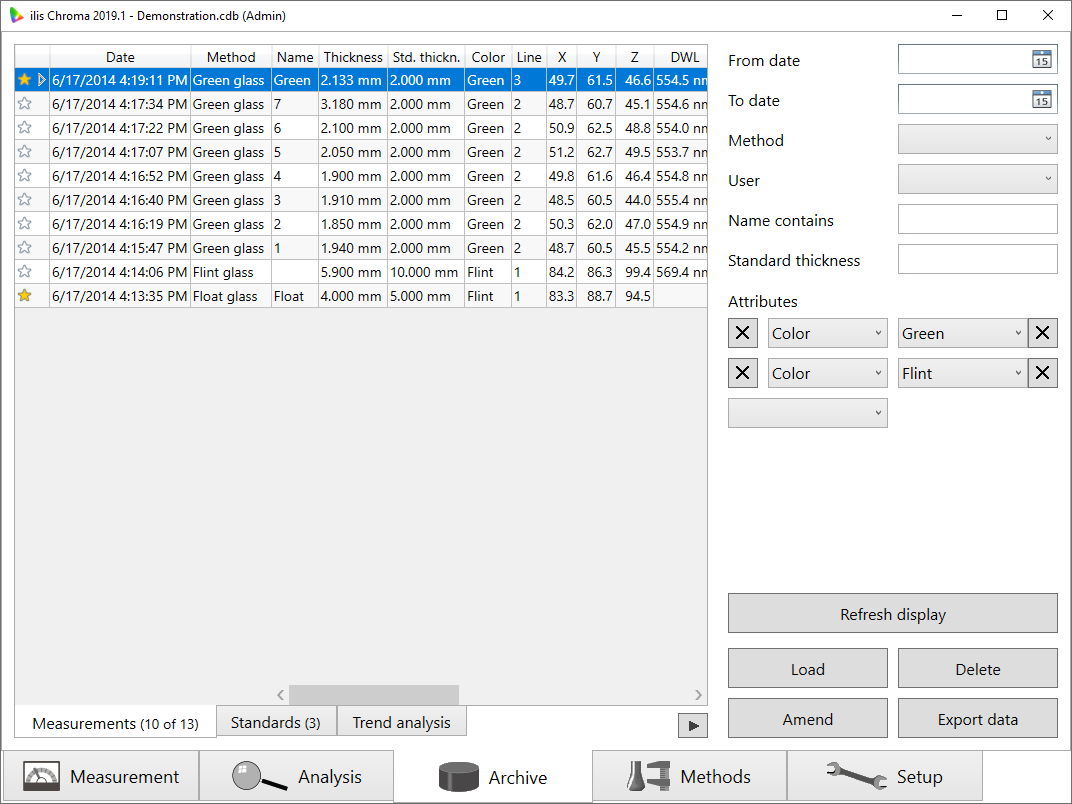
All measurement results are archived in Chroma in an integrated database and can be reloaded and evaluated at any time.
To organize the measurements, it is possible to define arbitrary attributes that can be filtered in the archive.
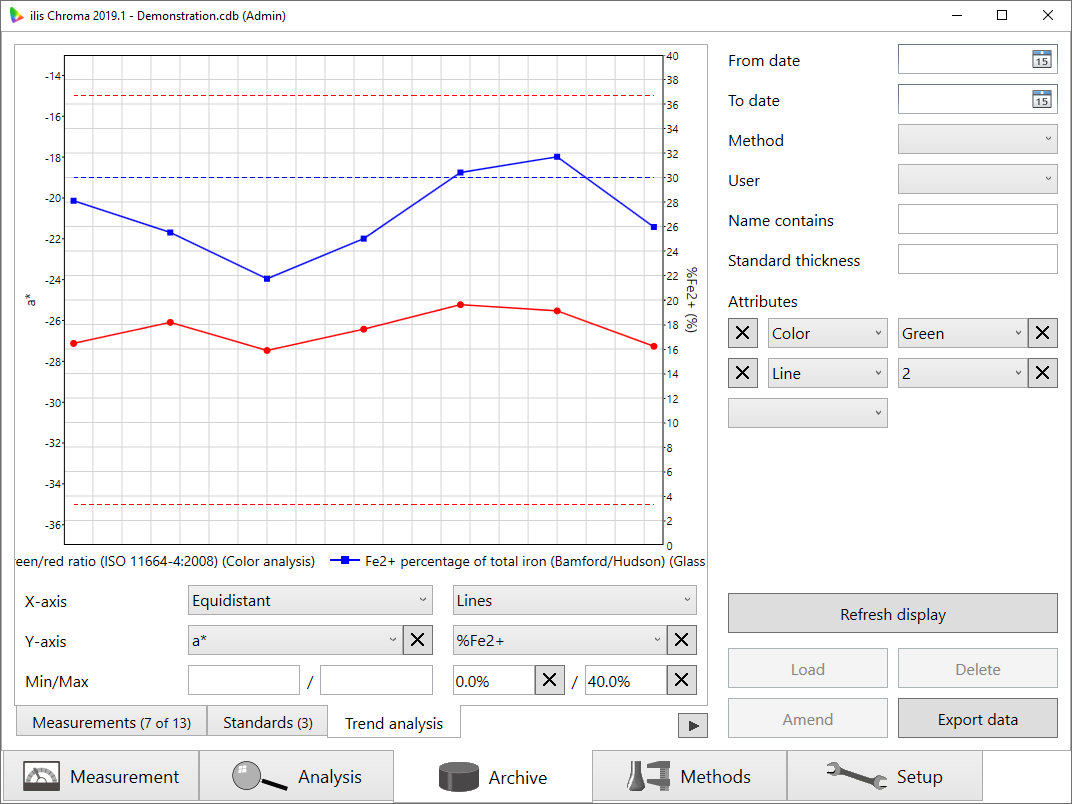
As an alternative to displaying in tabular form, the data can also be displayed graphically in the form of trend diagrams.
In this way, critical trends in the development of certain color values can be easily recognized and appropriate countermeasures can be initiated quickly.